A CBM (condition based maintenance) program at a nuclear reactor station
This paper described the steps, using a specialized software package, called EXAKT (Ref 3.), for building an optimized condition based maintenance policy model to be inserted as an intelligent agent alongside a computerized maintenance information management system (CMMS) and a database containing the results of condition monitoring (CM).
Abstract
Hydro-dyne seals perform an important function in some CANDU type reactors. During refueling, they seal the connection between the fuelling machine and the end fitting of the reactor fuel channels, preventing the leakage of heavy water from the reactor. At nuclear power plant 4 reactors employ 8 hydro-dyne sealed refueling mechanisms.
Keeping track of the condition of each seal
Keeping track of the condition of each seal poses a particular challenge to site engineers and safety and environmental considerations have prompted a 100% inspection regimen. That is, prior to each use, after having positioned the refueling machine adjacent to the target reactor tube, the operators check for leakage by measuring the pressure drop in the seal over a fixed time interval. If the seal fails the test, they abort the intended operation and perform the required maintenance. As a consequence of failure, the plant will have incurred the costs of setting up for the cancelled refueling operation, some loss in energy efficiency due to the delay in refueling, and some organizational disruption due to lack of planning of the resulting emergency maintenance work in addition to the direct cost of seal replacement.
Engineers desired to perform timely preventive seal replacements in an attempt to minimize the overall costs due to failure and maintenance. To determine the optimal moment at which to perform proactive maintenance, they investigated a statistical decision methodology incorporating the technique of proportional hazards modeling (Ref. 1). This paper examines the methodology and the results of applying it to the inspection and event data from the refueling operations at the nuclear station reactor Plant B site taken over an 11-year period from 1990 onwards.
Introduction
A reactor produces hot water or steam that is used in power generating turbines and other equipment.
Condition Based Maintenance (CBM) may be considered the noblest form of maintenance because it is meant to intervene before an actual "functional" failure of the asset has taken place. It is therefore, the first tactic to be considered when developing a failure management strategy. To be selected it must be both technically feasible and economically worthwhile (Ref. 2). In the Plant B operation, this meant that seal preventive replacement be performed, but not so frequently as to nullify its economic benefits.
A reactor produces hot water or steam that is used in power generating turbines and other equipment. Plant B has 4 CANDU (CANadian Deuterium Uranium) reactors, each capable of producing 540 MW of power. CANDU is a pressurized heavy water; natural uranium power reactor first designed in the 1960's by a consortium of the Canadian government and private industry. All power reactors in Canada are of the CANDU type (of varying vintage).
Each reactor contains 380 channels that contain uranium fuel bundles. There are 12 bundles on each channel. The bundles produce neutrons by a fission process. The neutrons activate other neutrons to start a chained fission reaction. This process produces flux that heats the water surrounding the channel. The heated water is then transported to the thermodynamic power generation process.
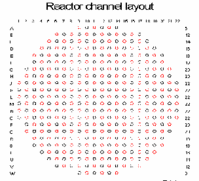
Each channel's fuel bundles produce a level of flux depending on its used life. Flux is highest for new fuel bundles and lowest for the oldest one. The fuel bundles are changed when their flux producing capacity decreases beyond an economic limit point. Typically bundles are changed out in groups of 4, but a single recharge can go as high as 8 for channels on the periphery of the reactor. Each reactor is a cylinder whose circular ends face east and west. The channels are thus cylindrical sections in the east-west direction. The flow of water in a particular channel may be either east or west in direction, while the adjacent channels flow in the opposite direction. The arrangement is shown in Figure 1. New fuel bundles are inserted into the channels on the side from which the water enters the channel. The flux will decline linearly from entrance to exit, but it will be complemented by the flux from adjacent channels whose flow is from the opposite direction.
The channel feeding machine that inserts fuel bundles into the channels, consists of the following three sections:
· Snout: The snout grips the channel's end fitting and aligns with the channel ready for insertion of the fuel bundles.
· Magazine: The magazine in the middle part of the feeder operates on the principle of a six magazine pistol. It has six rounds of fuel bundles, each round containing a pair of fuel bundles for a total magazine charge of 12 bundles. In normal operation, however, for a single fuel bundle replacement operation, only two slots of the magazine are used.
· Ram: The Ram pushes fuel bundles into the channel. The ram is operated twice in a single fuel charging cycle to push two pairs of fuel bundles into the channel.
Each reactor is housed in a room called the FM vault. The east and west side channel feeders are parked in a service room beneath FM vault when not in use. They are lifted into position on box screw lifting jacks and positioned on either end of the target channel. Control of axial, vertical, and horizontal fine and course motion in an XYZ coordinate system and an angular tilt adjustment permits the feeder snout to be positioned and aligned precisely at the target channel guided by feedback from proximity sensors and probes. 22 rows (designated A to W) and 22 columns (numbered 1 to 22) form the channel matrix identifying a given channel, for example S12, as row S column 12. Figure 1 depicts the reactor channel layout. “East” and “West” in the legend refer to the direction of heavy water flow in a channel.
Once in position the snout is clamped to the channel end fitting and the hydro-dyne seal engages to prevent radioactive D2O leakage during bundle insertion. However, prior to bundle insertion, the seal is checked for fitness of operation by pressurizing it with water. The pressure drop is recorded over a 5 sec interval. If it exceeds the limit of 3.5 MPa the feeder is lowered back into the service room where the seal is replaced - a 4-hour maintenance operation. Otherwise the ram inserts the bundle facilitated by the water flowing in the same direction. The heavy water (D2O) pressure inside a channel is 8-9 MPa at a temperature 300 deg C. When the snout is clamped onto the end fitting, the closure plug is opened and the pressure becomes uniform throughout the feeder and channel. Leaked D2O converts to D3O (tritium) and is sucked and transported to another plant.
On average 2.2 channels are replaced per reactor per day or nearly 9 fuel bundles altogether per day. Although the plant operates 24/7 both fuelling and maintenance are performed during the 10 hour 'morning' shift. The entire insertion/retraction cycle, that is moving the fuelling machine from the service room to the FM vault, aligning, clamping, and testing takes between 30 minutes and 1 hour. The normal planning horizon for the maintenance crew is 6 weeks. A failure provoked hydro-dyne seal emergency replacement incurs an extra administrative cost over a replacement that could be planned during the ample feeder idle times.
Data Acquisition
Two types of data are required for optimal decision modeling of the CBM (condition based maintenance) process - inspection data and events data. Inspection data consists of all the recorded tests performed on each hydro-dyne seal along with the date of inspection and the corresponding working age of the seal. The event data comprises the dates and working ages at particular events, most importantly, the installation of a new seal, the failure of a seal, or the replacement of a seal that has not yet failed. If there are other events that would impact the test results such as a minor refurbishing or adjustment, they should, as well, be included in the events database. A total of 10,417 inspections were recorded on all 4 reactors with the breakdown per reactor given in Table 1. The working age is the number of service usage units since new. A service usage unit should be selected such that the working age is proportional to the accumulated stress on the asset since its installation. In the case of the hydro-dyne seals, the service usage unit was chosen as one fuel charging cycle.
Data preparation
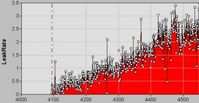
In any data modeling exercise, the data preparation phase, is of utmost importance. The inspection data from all four reactors, namely 5, 6, 7, and 8 were acquired and intensively examined. It was quickly determined from the plots of Pressure Drop versus WorkingAge (Figure 2) that the seal "ages". That is the conditional probability of failure grows with increased working age.
Failure codes in the maintenance database are equally important but should be filtered with caution because most organizations have provided little or no guidelines to employees for the consistent and objective classification of failure modes (internal events with cause a functional failure). Most maintenance databases contain information on what was replaced and on what actions were performed but seldom on precisely what failed nor why. Until managers in maintenance organizations recognize the value of recording failure mode information, this will remain a principal obstacle to optimizing CBM policies.
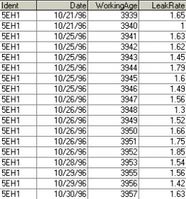
The first step in the data preparation procedure was to filter the maintenance work order data to yield all of the hydro-dyne seal replacement and other relevant events, the reason for replacement, the date, and the working age. This step yielded 768 records for all four reactors. Table 2 shows the required format for the event data. "Ident" denotes the locations of the hydro-dyne seals. For example, "5E" designates seal location on the east side of reactor 5. It is often expedient in the case of a large population of asset histories to segment the Ident further by allowing each asset ‘lifetime’ be represented by an Ident. For example 5EH1 designates the first seal lifetime at location 5E, 5EH2 the second, and so on. Table 3 defines the events required for the data modeling process. An "SM" or "start monitoring" event needs to be included whenever the collection of inspection data begins well after the time at which an asset, in this case a seal, has been placed into service. The "B", "EF", and "ES" events designate respectively installation, ending by failure, or ending for a reason other than failure, for example, due to a preventive replacement.
Typical inspection data as depicted in the graph of Figure 2 is given in tabular form in Table 4. Note that the working age does not necessarily begin at “0” for a given lifetime history. It may be recorded in the database as an arbitrary count from a meter, controller, or computer governing that particular asset or location. The modeling software accounts for any offset knowing the date and working age of the beginning (B) event.
Figure 2 illustrates a prominent random component in the measured data. The decision model must be developed to compensate for the erratic nature of the data so that the correct decision, either to replace the seal or not, may be made following each successful inspection-insertion-retraction cycle. Several smoothing strategies were investigated before selecting one to be incorporated into the decision model. Smoothing is useful for reducing sample variation and to more clearly show any trends in the data. Smoothing is applied to every history record taking into account all records within a specified distance (in working age units). Smoothed values are calculated as a kind of weighted average. Figure 3 displays the untransformed data while Figure 4 shows inspection data transformed by a smoothing and averaging function that calculates a smoothed LeakRate value at the given working age as the simple average of all LeakRate records from that history within the specified interval (t-10, t+10). I.e. all points are equally weighted in the calculation.
The Smooth transformation of will first fit a linear function to all LeakRate records from that history within the interval (t-10, t+10). The points are assigned weights that decrease linearly from the point t to the end points t-10 and t+10. Then it will calculate the smoothed LeakRate value at the time point t, as the value of the fitted function at that point.
Graphical examination of each history lifetime revealed a relatively small number of histories which did not exhibit an increasing trend similar to those depicted in Figures 3, 4, and 5. Deeper investigation concluded that instrument malfunction accounted for those atypical patterns or in some cases it was obvious that beginning and ending events were missing from the maintenance database. The offending histories where removed from the sample during this data validation phase and prior to the subsequent modeling phase of the exercise. A small number of outliers (by more than 3 standard deviations from a linear regression line fitted to the data) were removed from most histories in the sample for the same reason.
The model’s fit to the data was evaluated using several statistical graphical methods as well as the Kolmogorov-Smirnov goodness of fit test. Although the latter test rejected the model, the statistical-graphical methods applied by the software indicated that the proportional hazards model was in fact a good fit. Not all statistical tests are appropriate to all situations and the explanation for the failure of the K-S test is that ………. Figure 7 displays the results of the variance stabilized transformation statistical graphical test for goodness of fit. This graphical method uses the residuals arranged in ascending order against their expected values. If the Weibull PHM fits the data well, it is expected that the points be scattered around the line y = x. Inspection of this graph judges the fit to be good.
Markov Chain Transition Probability Model
Once the proportional hazards model has been constructed, the next phase of the optimal decision modeling process is to add a Markov chain transition probability calculation. This process first determines a reasonable set of states for the LeakRate variable that was found to be a key risk factor in the previous phase of the analysis.
Figure 8 shows the default transition bands or states selected by the software while Figure 9 displays the entire set of LeakRates for all 8 hydro-dyne seal locations plotted against their working ages. Examining Figure 9 one may attest to the reasonableness of the low, medium, high, and very high states into which the LeakRate values were placed by the software’s transition state algorithm. One may, if deemed appropriate override the default transition states.
One result of the Markov chain transition probability calculation is displayed in Figure 10. For a given age, for example 300 cycles and a given observation interval, say 10 cycles the matrix of Figure 10 indicates that if the current state is 1.533 to 2.433 then the probability of not surviving the next observation interval is 7.5%. While, the user does not typically use this matrix directly, it serves to illustrate the contribution of transition probabilities to the final decision model to be constructed in the next phase of the analysis.
Economic Model and Optimal Decision Policy Model
The final phase in the construction of an optimal CBM decision model blends the economic factors governing the relative costs of planned and emergency maintenance into the combined proportional hazards and Markov chain transition probability models developed thus far.
Once the decision model has been calculated, the graph of Figure 11 is displayed which reveals a minimum cost as a function of risk. The minimum cost obtained by following the recommendations of the model each time an inspection is performed is given in Table 5 as $10.85 per cycle. By consistently adhering to the recommendation a 52.5% saving may be realized over the current replace-on-failure policy. The optimum mix of preventive and failure maintenance that will result from using the model is given, in the table as 89.5% to 10.5%.
The actual decision may be displayed in an “optimal decision graph” (Figure 12). An “intelligent agent” that has been configured to execute the model constructed during the course of the analysis as each new inspection result becomes available in a database may generate the graph and the resulting optimal recommendation. The agent, in the case illustrated by Figure 12 would have recommended a preventive seal replacement at a working age of 380 cycles or about 50 cycles prior to actual failure.
Conclusion
This paper described the steps, using a specialized software package (Ref. 2), for building an optimized condition based maintenance policy model to be inserted as an intelligent agent alongside a computerized maintenance information management system (CMMS) and a database containing the results of condition monitoring (CM). The model unifies the two data sources by establishing which data are key significant risk variables and then by calculating their relative influence on failure. Furthermore it blends in economic factors in order to provide an automated system for making optimal decisions given an asset’s current working age and its latest monitored condition data. The optimization objective may be set in the model as lowest overall cost, highest average asset availability, or adherence to a minimal risk criterion or to a stated policy declaring a desired ratio of preventive to failure maintenance. In the simplest terms, the decision model provides a maintenance planner or manager with an unambiguous recommendation to replace an asset or keep running.
References
1. Jardine, A.K.S., Banjevic D. and Makis V, (1997) “Optimal replacement policy and the structure of software for condition-based maintenance”, Journal of Quality in Maintenance Engineering, Vol. 3, No.2, pp. 109-119.
2. Reliability-centred Maintenance, John Moubray, 2nd edition Butterworth Heinemann


