Optimization of Bellis & Morcom 3rd-stage piston ring CBM model
This report is an evaluation of EXAKT at a steel mill. The discussion focuses on data collection and manipulation. A brief discussion on the capability and usefulness of EXAKT is also included in the conclusion. The objective was to determine whether EXAKT could be effectively utilized in a commercial manufacturing environment to improve the results obtained with current (PM) models.
Table of Contents
Optimization of Bellis & Morcom 3rd-stage piston ring CBM model.. 1
1.1 Project Objective. 22 Scope of study.. 3
3.1 Condition indicator data.. 34 EXAKT Modeling.. 5
6.1 Modeling with cleaned data.. 117 Conclusion.. 67
The objective of this report is to provide an overview of the progress with the evaluation of EXAKT at Steel Mill. The discussion will be focused around the data collection and manipulation phase of the project. A brief discussion on the perceived capability and usefulness of EXAKT is also included in the conclusion. Before launching into the progress report the project objective and the theory behind EXAKT will be reviewed.
The objective of this study is to determine whether EXAKT can be effectively utilized in a commercial manufacturing environment to improve the results obtained with current predictive maintenance (PM) models. In order to address practical concern this project will be approached from two angles. The first is to evaluate EXAKT by using historical data and the second would be to build a complete (ideal) data set for future use and for sharing with others. This is one of the reasons why the reciprocating compressors at Steel Mill have been chosen as the test site. Reciprocating compressors are widely used in industry; therefore any insights gained from this study will most likely be useful to the other members.
Figure 1 – Failure patterns E and F as shown in RCM2 by John Moubray
In his book RCM II – Reliability-centered maintenance, John Moubray states that more than 60% of all equipment failures are not directly related to the working age of the equipment. These types of failures are also referred to as random failures. An illustration of the failure rate compared to working age is shown in Figure 1. According to this theory conventional preventative maintenance will not always reduce the failure rate and in some cases may even increase the failure rate by introducing infant failures. The best method of dealing with random failures is to base maintenance decisions on the condition of the equipment. On-condition maintenance is the science of determining which measurable indicators can be used to describe the condition of a component. The objective in developing suitable Condition-Based Maintenance (CBM) models is to obtain the maximum useful life from each physical asset before taking it out of service for preventative repair. The challenge is that the interaction between different indicators can be complex and difficult to optimize. Most CBM models are not capable of accurately defining the risk of failure between inspections. One method to calculate the risk of failure is to use Proportional Hazard Modeling (PHM). This method tries to account for the influence of both the physical condition indicators and the working age on the statistical probability of failure.
PHM is the key element around which EXAKT is built. The Proportional Hazards Model used in EXAKT is a Weibull failure model with time dependent covariates to incorporate the condition information. Its hazard function h(t) has the general form of the formula seen here.
where
t = working age
z1…zp = the relevant measured condition indicators
b,h,y = statistical parameters estimated from historical data
The PHM is used to find a mathematical relationship between the risk of a component failing and the condition information together with working age. A Markov chain model is used to describe the behavior of the condition over time. This, together with the PHM forms a complete statistical model that is used along with cost information to calculate the corresponding optimum component replacement strategy. From this, replacement decisions are obtained for individual components that depend on their ages and the most current condition information.
To use EXAKT, three types of data are required:
1. Regularly measured diagnostic data that reflects the health of the equipment (condition indicators).
2. Lifetime data on the equipment (maintenance events).
3. Cost data for replacements and failures respectively, related to lost production, collateral damage, item replacement, etc.
The focus of this interim report is on the first two items, regular measured diagnostic data and lifetime data.
The first step in any EXAKT study is to be clear on what failure mode will be the focus. Most pieces of equipment are complex systems with a multitude of failure modes detectable by different combinations of condition indicators. EXAKT, by default, does not distinguish between different failure modes, but the event databases used by EXAKT can be structured such that individual failure modes are distinguishable. If all failure modes were treated as a single failure mode in the Events data table fed into EXAKT, EXAKT will most likely not detect any correlation between the condition data, working age and the failures. Secondly it is best to target failure modes for which ample historical records of condition data and corresponding maintenance event data exist. In order for EXAKT to build an accurate model, all the significant condition indicators must form part of the condition indicator database. If the wrong indicators are being collected EXAKT will either construct a poor model or no correlation will exist between the failures and the condition data. EXAKT should however be capable of identifying the significant condition indicators without any human assistance. In theory EXAKT could even identify a previously unknown correlation between a condition indicator and a failure. Targeting mature CBM programs also ensures that enough historical data is available to estimate statistical parameters with some confidence.
After discussing the above requirements with the compressor maintenance personnel it was decided that the piston ring failures on the Bellis & Morcom compressor in the nitrogen plant is the most suitable equipment group for this study. Initially it was thought to include the piston rings of the 1st, 2nd, and 3rd stage in the same study. This concept was however abandoned because the difference in operating conditions of the various stages, will in all probability cause their relationships to the measured condition indicators to differ. It was then decided to single out the 3rd-stage rings for this study since it offered the highest number of failure histories to analyze. As mentioned earlier one needs to be very specific on the failure mode (FM) and the functional failure (FF). For this study the FM and the FF was defined as follows:
Failure mode: Excessive wear/damage of Bellis & Morcom third-stage piston rings.
Functional Failure: It was decided that a piston ring would be classified as failed if the radial thickness is less than the minimum specified by the vendor. (0.268 in)
Steel Mill stores all their maintenance data in an electronic database. The information in the database can be accessed in two ways. It can be viewed by login on to the Computerized Maintenance Management System (CMMS). This has the limitation of not allowing the user to manipulate the data. Alternatively the information can be accessed, by linking to the Decision Enabling Environment (DEEP) ODBC database using Microsoft Access. The advantage of the second method is that the data can be manipulated and stored in new tables that contain only the data required for the EXAKT study. As explained earlier two separate sets of data are required. The one set must contain all the collected condition indicator data and the second set must contain all the maintenance data for the same period. Only the failure events for the targeted failure mode must be flagged as “failure” in the second data set. Condition indicator data and piston ring failure maintenance data for the period 1/1/2000 to 9/30/2001 was collected.
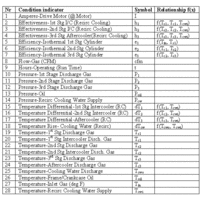
At present Steel Mill has 28 condition indicators for each compressor. The sample frequency varies from 12-24 hours. Only the condition indicators that can be collected without taking the compressors off line were considered. Not all of these indicators are independent, some of them are functions of other indicators. The collection of online condition indicators and their relationship to one another can be seen in Table 1.
The condition indicator data for the selected sample period was retrieved from the DEEP-database and stored in a new table. By storing it in a smaller new table the amount of required computer time to run subsequent queries is dramatically reduced. The DEEP-database is also a read-only environment; it is therefore necessary to store the retrieved data in a new table if the format of the data needs to be changed.
The maintenance data is stored in the same database as the condition indicators. The first step was to retrieve all the work orders (W/O) issued against the compressor cylinders during the sample period. The second step was to look at the W/O descriptions and filter out any W/O’s that obviously had nothing to do with replacing the piston rings. In order to ensure that some W/O’s were not wrongly removed from the data set, a method to verify the data was required. This was done by comparing the W/O selection to the check sheets stored in the database. Every time a W/O is issued to inspect/replace the piston rings a check sheet is attached to the W/O. These check sheets form an integral part of the Equipment Maintenance Plan (EMP) of all equipment, and in this case it is used to record all the physical condition indicators of the piston and rings. Once the work is finished the maintenance person enters this data into the computer database before signing off the W/O.
Table 1 – Online condition indicators on Bellis & Morcom compressors
It was however found that there were more W/O’s left than check sheets. On closer evaluation it was found that all the W/O’s that did not have matching check sheets were issued during a period at the end of December 2000. This was discussed with the maintenance personnel. During the discussion it was revealed that during that period, problems were being experienced with the nitrogen supply that led to numerous ring failures. It may explain why the standard procedure of entering the check sheets into the computer did not happen, since some of these failures occurred during weekends and after hours.
The information in the check sheets was also used to determine whether the piston rings were in a failed state when they were replaced or whether they were replaced prematurely. In any case where the ring measurements triggered a critical status message, the rings were deemed to have failed.
Once collected the data needed to be transformed into the format required by EXAKT. The big difference between the collected data and the required format is that CMMS stores the data in a row wise format while EXAKT needs it in a column wise format[1]. The difference between column wise and row wise data storage is illustrated in Table 2 and Table 3.
Table 2 - Example of row wise data
Table 3 - Example of column wise data
One of the important variables required by EXAKT is the working age of the equipment at each event (inspection, failure, suspension, etc). EXAKT uses the working age as a measure of the amount of equipment service since last renewal and as an index to sort the events in the correct sequence. Any metric can be used to specify the working age as long as it is an accurate indication of the amount of work a piece of equipment has performed or the amount of stress it has undergone since new. Two popular metrics used to define the working age are:
1. Calendar time and
2. Operating hours.
Calendar time can be used if daily utilization of a piece of equipment is constant. If the utilization varies operating hours is a more accurate indication provided average load is more or less constant from one 12-hour period to the next. It is also good practice to incorporate any other variables that may influence the amount of work a piece of equipment has performed in the working age metric.
In the case of the reciprocating compressors it was felt that a good method of accounting for any variation in utilization would be to express the working age as a function of the volume of nitrogen compressed by the compressor in cubic feet (cf). This metric will account for any downtime between events and for any variation in the load (cfm) on the compressor.
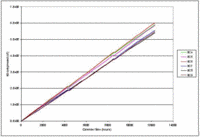
To test whether this metric gives a better indication of working age than calendar time a graph comparing the two was constructed. In Figure 2 it can be seen that all the trends are essentially straight lines. This is a result of the fact that the 6 Bellis & Morcom compressors provide the base load for the plant, while standby capacity is provided by a series of liquid pumps. This indicates that there is no real advantage in using a more complex working age metric than simply expressing it in terms of calendar time.
Figure 2 – Calendar time vs. Volume of nitrogen compressed
The first experiment was to test what would happen if EXAKT was asked to prepare a CBM model from the raw, unedited data. From experience it is known that the third stage piston rings last about 3 months and that when they are worn the 2nd-stage pressure (P2) starts to increase. Knowing this at least serves as a basis against which any model generated by EXAKT can be compared.
This was a test to see whether EXAKT is capable of determining the condition indicators that are linked to 3rd-stage ring failures, using a non-ideal data set. Most data sets that are compiled by just extracting the data from an electronic database will have some errors. There will be some missing data points because not all condition indicators can always be recorded. Sometimes errors are made when the data are entered into the computer. There may also be some failures that were due to unusual factors. The otherwise significant condition indicators may not show any changes in these instances. EXAKT has some built-in functions to deal with these errors, but their use require statistical experience and careful assessment of the assumptions made in using these functions are not always correct.
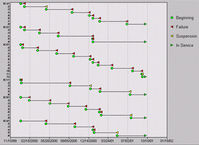
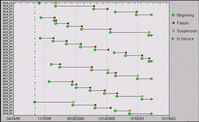
The first run yielded no results. EXAKT was not able to isolate any significant condition indicators. The second run was done with b set to 1. This is the same as assuming that working age has no affect on the likelihood of failure. This helped EXAKT to conclude that both P2 and e1 are significant in predicting the failure of the 3rd-stage piston rings. As mentioned earlier it is known that P2 can be used to check for 3rd-stage ring failure. The significance of e1 will have to be investigated further as it is not used as an indicator at present. Despite this encouraging improvement of the correlation detected by EXAKT, it is not good enough to build an accurate CBM model. EXAKT uses a Kolmogorov-Smirnov (K-S) test to determine the accuracy of a model. The K-S statistical test is used to check whether residuals calculated from an estimated Weibull PHM follow a negative exponential distribution. The test calculates the distance between the theoretical exponential distribution, and the distribution estimated from the residuals, adjusted for suspensions, and reports the p-value. If the p-value < 5% then there is a good correlation between the actual and expected distribution. In this case the p-value was 10%. It is however known from experience that working age influences the risk of failure of the piston rings. It is therefore important to determine why EXAKT was not able to find any link between working age and the risk of failure. The history lengths of the rings as recorded in EXAKT are shown in Figure 2. Three aspects are noticeable:
1. The majority of the history lengths seem to be in the 3-month range as mentioned earlier.
2. During the end of December 2000 all the compressors experienced piston ring failures with very short history lengths. This coincides with the period when problems were experienced with the nitrogen supply.
3. There are two very long histories of about 8 months each. It might be that the rings were replaced without recording it.
Figure 3 - Length of 3rd stage piston ring histories
The conclusion from this first test is that:
· The probability of achieving useful results with EXAKT from unedited data is very low.
· One will need to check all the data used for modeling, especially the event data, to ensure that all the maintenance events are present.
· EXAKT will return the correct answer over the long run if the failure mechanisms causing the failure mode are stable. If new failure mechanisms appear (say due to a mechanical or process modification) that were not present when the model was developed the EXAKT model cannot predict failure by these new failure mechanisms. Nevertheless, it is quick and straight-forward to update the model as new datapoints (lifetimes) are experienced. The EXAKT cost comparison function provides the means for continuously monitoring the model’s effectiveness.
The conclusion that can be made from the first test is that before any further tests are done in EXAKT the data must be cleaned. This needs to be done to ensure the integrity of the data given to EXAKT. The following basic points need to be addressed when reviewing the data:
1. Check that all maintenance events are accounted for.
2. Remove or replace any inspection data that are obviously incorrect.
3. Remove any histories that are very long or very short as a result of special circumstances.
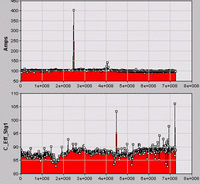
The first step would be to eliminate all data that was entered incorrectly. The easiest method of doing this is to display a graph of each indicator. It is then possible to visually check for any samples that are obviously out of range. In the history graph for drive motor electric current (Figure 3) the incorrectly entered sample can clearly be seen. By studying each graph the incorrect data can be corrected.
Figure 4 - History graphs for motor amperes and inter-cooler efficiency
The second step would be to remove from the study all the short histories that were caused by the known problems with the nitrogen supply.
A further data problem has to do with the timestamps of the maintenance events. Every W/O has three dates associated with it:
· Creation date
· Finish date
· Close date
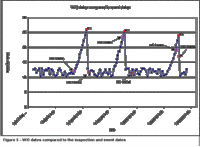
None of these is an exact indication of when the failure occurred. The ‘creation date’ is the date and time when the planner entered the W/O into the system. This can sometimes be weeks before the work is actually done. The ‘finish date’ is the date and time the millwright reported that the work was finished. This is usually a few hours to a few days after the equipment has been placed back into service. The ‘close date’ is the date and time when all the financial transactions for the work are finalized. This is usually a couple of weeks after the incident. The problem of not having the exact date and time of failure can best be explained with the aid of a graph. In Figure 4 the trend for a condition indicator that is strongly related to a failure mode is shown. EF1, EF2 and EF3 denote the values and dates of failure. The relative positions of the W/O dates are also indicated on the trend.
It can be seen in Figure 5 that none of the W/O Creation dates will be a good approximation of the associated failure date. If the W/O Creation date is used it will look as though the indicator keeps on rising for a period even after the failure has been repaired. This would cause one to predict a failure sooner that it actually happens. Coversely if the W/O Finished dates are used one would tend to predict failures later than they actually occurred. For a date to be suitable it needs to fall between the last inspection before failure and the first inpection after repair. An example of a suitable date is the W/O Finished date associated with EF3.
Combining the W/O data with the flow measurements logged by the PI-system in the following manner solved this problem. It is known that the W/O Finish dates are always recorded after the maintenance work has been completed and that a compressor delivers zero flow when it is down for maintenance. It is therefore possible to pinpoint the exact time of the mechanical event by finding when the compressor registered zero flow on the PI-system just prior to the W/O Finish date.
6.1 Modeling with cleaned data
Having cleaned the data by replacing all incorrectly entered data with interpolated or average values, removing all uncharacteristically long or short histories (Figure 6) and correcting the date and time of the mechanical events the modeling phase was started.
Figure 6 - Histories after data was cleaned
A cost factor of 4 for (c+k)/c was used throughout the analysis to compare the cost of the different maintenance strategies with the current approach.
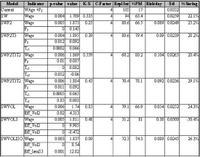
The first model that was constructed was a simple-Weibull model. This was done to evaluate the significance of the working age of the cylinder rings in predicting their failure. The results of the analysis are shown in Table 4 –Model: SW. It can be seen that working age is definitely significant (p-value = 0.004). It is also noticeable that the optimum replacement age calculated by EXAKT would have resulted in an increase in PM and a 22% reduction in cost.
After establishing the significance of working age the current strategy of using working age in combination with the 2nd-stage discharge pressure, to form a CBM model, was evaluated. Again it was found that both condition indicators are significant in predicting failure (Table 4 – Model: SWP2). Using EXAKT it was possible to construct a model that would increase the amount of PM with a net cost reduction of 25% compared to the current situation. This model was further expanded by alternatively evaluating each condition indicator and adding the one with the lowest p-value to the model. By repeating this method it was found that a model incorporating working age, P2, Ts3 and Ts2 gave the best results with a predicted saving of 29% (Table 4 – Model: SWP2T3T2).
Table 4 – Results from EXAKT modeling
The effect of using condition indicators that consists of combinations of measured parameters was also experimented with. Two compressor efficiency parameters namely isentropic and volumetric efficiency was chosen for this purpose. As can be seen in Table 4 – Models: SWVOL, SWVOL3 and SWVOLISO this did not improve the predicted performance of the calculated CBM model although one would have expected it to improve because these parameters should account for normal variations in operating conditions.
6.2 Further refining of models
The above results along with the refined database were sent to the CBM-lab for further analysis. That analysis and subsequent discussion at the University of Toronto were addressed in the following:
· Events HX1, HX2 and HX3 accounting for the sudden sustained fall in temperatures after the heat exchanger overhauls were added to the event table. It was found that these drops in temperature coincided with the replacing or cleaning of the heat exchangers that cool the compressed air after each compression stage. These events had not previously been considered by maintenance staff as significant in interpreting monitored data in order to decide when to replace rings.
Figure 7 - Sudden sustained drop in temperature after HX replacement
· The obvious outliers in the data that were missed during the data cleanup were replaced with interpolated values.
· Most of the data was left unchanged because it was felt that the readings were correctly entered into the CMMS system and that the variation was due to normal process changes and instrumentation tolerances
After the changes were made the modeling process described in Section 6.1 was repeated. It was found that the changes in the data and some refinements in the modeling resulted in a model that raised the expected savings from 29.1% to 44.8% (SWP2T2T3). The improved results can be viewed in Table 5.
Table 5 - Results from new Exakt version that fits model to the data
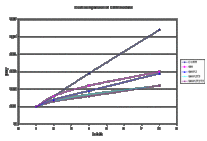
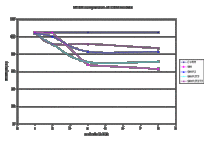
In Figure 8 and Figure 9 the performance of the individual models can be compared when the cost ratio is changed. It is interesting to note that even the simple–Weibull model will perform better than the current strategy if the cost ratio is larger than 4. Although a cost ratio of 4 was used to evaluate the models substantial savings will be possible even if the cost ratio was only 2. It is unlikely that the cost ratio can be much less than this because of the long term negative effects of running the compressors until the piston rings actually break.
Also worthwhile to note is that although the model incorporating P2 and TS3 performs almost as well as the model incorporating P2, TS3 and Tc2 as far as cost is concerned (Figure 8) the second model has definite advantages when it comes to the expected Mean Time Between Replacements (MTBR) (Figure 9). This means that although the maintenance cost when applying either of the two models will be almost the same, 23% less time will be spent on maintenance if the second model is used.
Figure 8 – Sensitivity of Exakt models to cost ratio
Figure 9 – Expected MTBR at different cost ratios7
My impressions on the use of Exakt and the current database can be summarized as follows:
· The Exakt software is definitely maturing and can be a very useful tool in reducing maintenance cost.
· A thorough CBM data collection methodology is needed to ensure that the data required by Exakt is available.
· Software like Exakt is a good aid to show people how condition and maintenance data they should be collecting can be utilized effectively to reduce maintenance cost. On the negative side it can also be used to illustrate how poor data collection practices prevents one from using the newest technology.
· Exakt is very useful when applied to equipment for which an ample and accurate database of condition and maintenance event data mature condition monitoring system is already in place. If data is less than adequate, the software highlights that fact. If there is no data at all, EXAKT can still be used to set up an initial “prior knowledge” model based on known or estimated component reliability. That model continuously improves as data collection procedures are upgraded. The software provides means for evaluating the effectiveness of the evolving decision model.
· The integrity of the data must be reasonably "good"; otherwise Exakt’s ’goodness of fit’ statistical tests may reject the model. Typically, because work orders describe "what was done" more than "what was found", the analyst, in retrospect, will have to guess whether a particular end of life was a suspension (preventive replacement) or a failure. If he guesses wrongly, the Kolmogorov-Smirnov goodness of fit test may reject the model. The solution will require a culture and process change in how work orders are completed. Technicians and planners, when closing a work order, will need to learn to enter the Event type; either PF (potential failure), FF (functional failure), or S (Suspension)
· The condition based data (indicators) collected for the Bellis & Morcom compressors is sufficient to adequately definemust be related to the condition of the piston rings, from a process perspective.
· The date and time of any maintenance or process events should be recorded accurately. It was found that this is the one area where the utilities department can improve their data collection process.
· The study using EXAKT has found that the data collection frequency on the Bellis & Morcom compressors is more than adequate and frequent enough to provide sufficient warning prior to failure.
· Some method should be found to automatically eliminate any errors that occur by validating data at entry. A suggestion is to make use of an automatic filter that would refuse to accept any data that are outside the specified range.
· All the CBM models (Table 4) that were developed by using Exakt seem to make sense since they confrm experience and compressor theory related to the failure mode under investigation.
· In order to analyze and judge the reasonableness of a CBM model developed with Exakt; the user must have a good practical and theoretical knowledge of the equipment under investigation.
· The data inadequacies raised by this study suggest a direction for guidelines and procedures governing the collection of “as-found” information by maintenance personnel at the time of proactive or reactive maintenance renewals.
· Lastly by using Exakt it was possible to show that a better indication of piston ring condition can be obtained by adding the 3rd-stage inlet- and outlet temperature to the current approach of just looking at the 2nd-stage discharge pressure. The associated hazard function has the form:
[1] The current EXAKT now accesses relational database tables that are in row wise format.


